Product analytics
The Product Analytics report provides an overview of your returned items data, helping you identify trends, high-return products, and the specific reasons why customers are sending items back.
This guide breaks down each section of the report so you can leverage these insights to optimize your product catalog and reduce return rates.
Key Performance Indicators
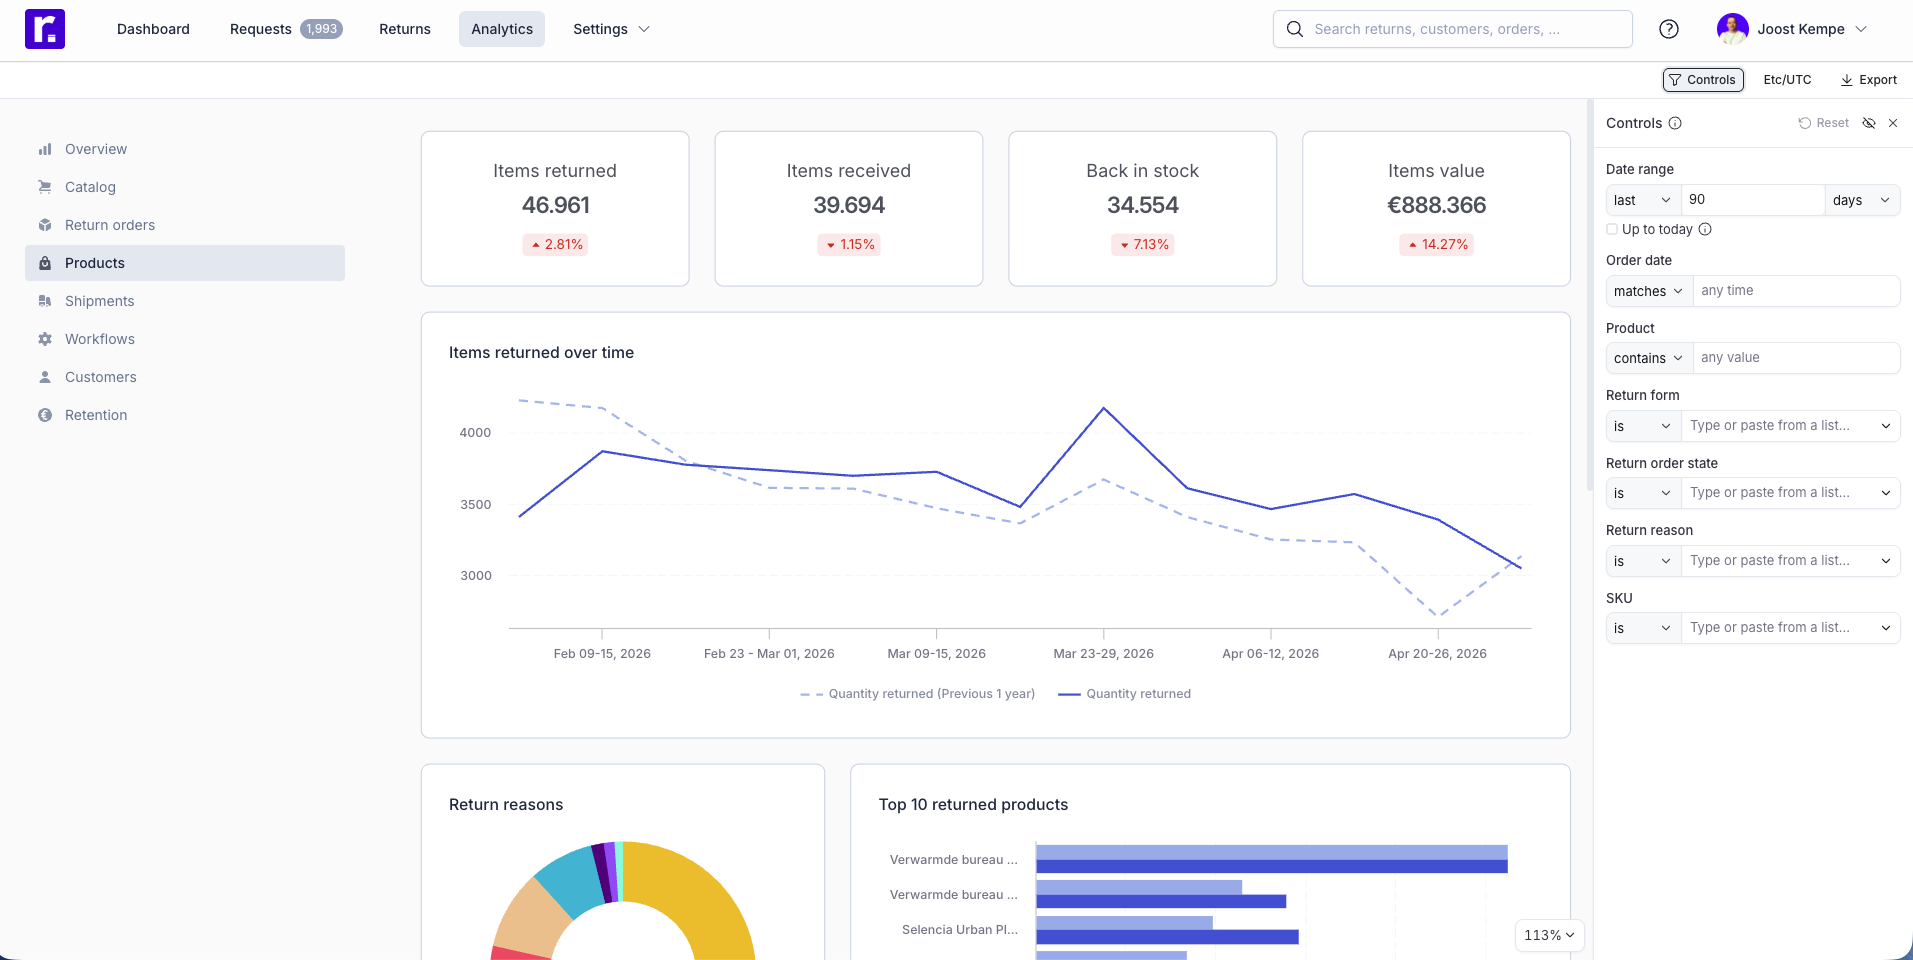
At the top of the dashboard, you will find four primary metrics covering the selected time range:
- Items returned: The total number of items for which a return was started.
- Items received: The number of items that have physically arrived at your warehouse.
- Back in stock: The number of returned items that have been processed and made available for resale.
- Items value: The total monetary value of all items that were submitted by your customers.
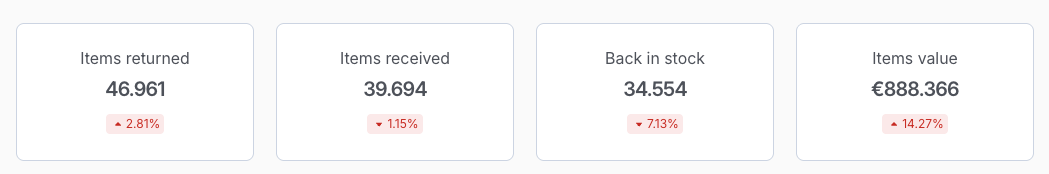
Note: The percentage indicator below each number shows the trend compared to the previous year.
Items Returned Over Time
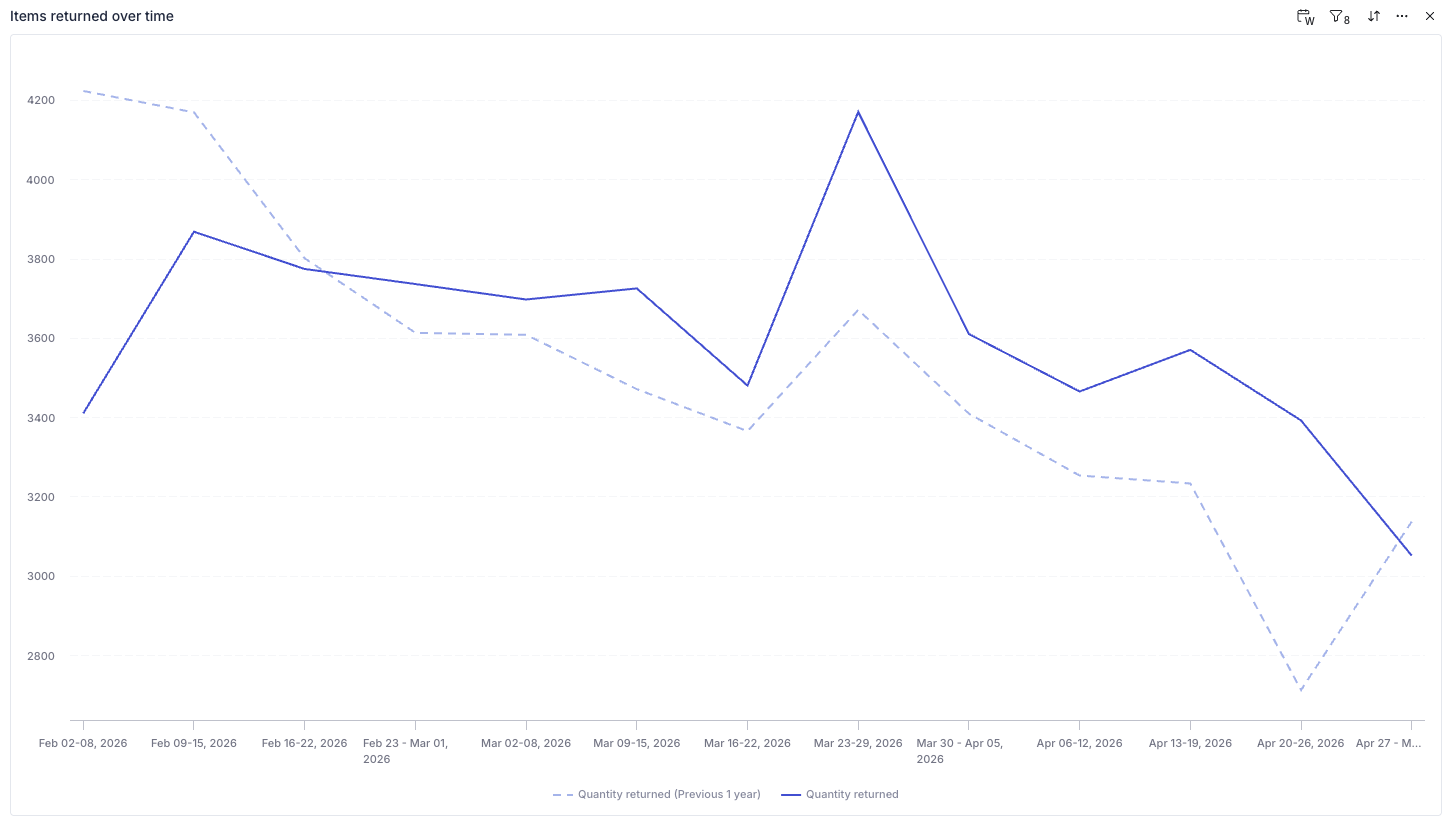
This line chart allows you to track return volume fluctuations.
- Solid Line: Represents your current return volume for the selected period.
- Dashed Line: Represents the return volume from the previous year, providing a year-over-year benchmark to help identify seasonal trends.
3. Return Reasons
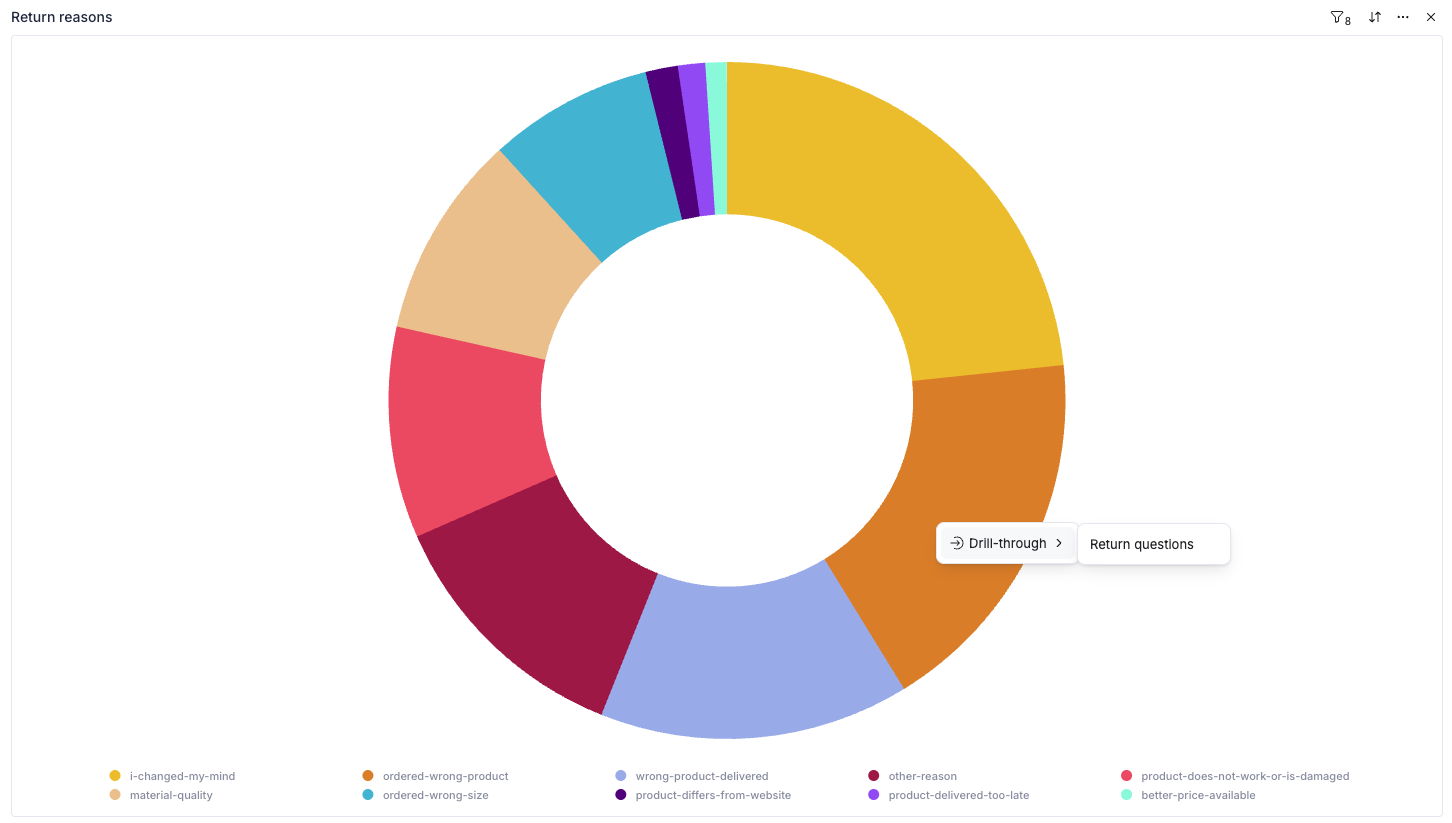
This donut chart categorizes why customers are returning products.
- Hover over any segment to see the exact count and percentage for that specific reason (e.g., "ordered-wrong-product").
- Drill-through: You can right-click a reason and select "Return questions" to see the specific qualitative feedback (open text answers) provided by customers for that category.
Top 10 Returned Products
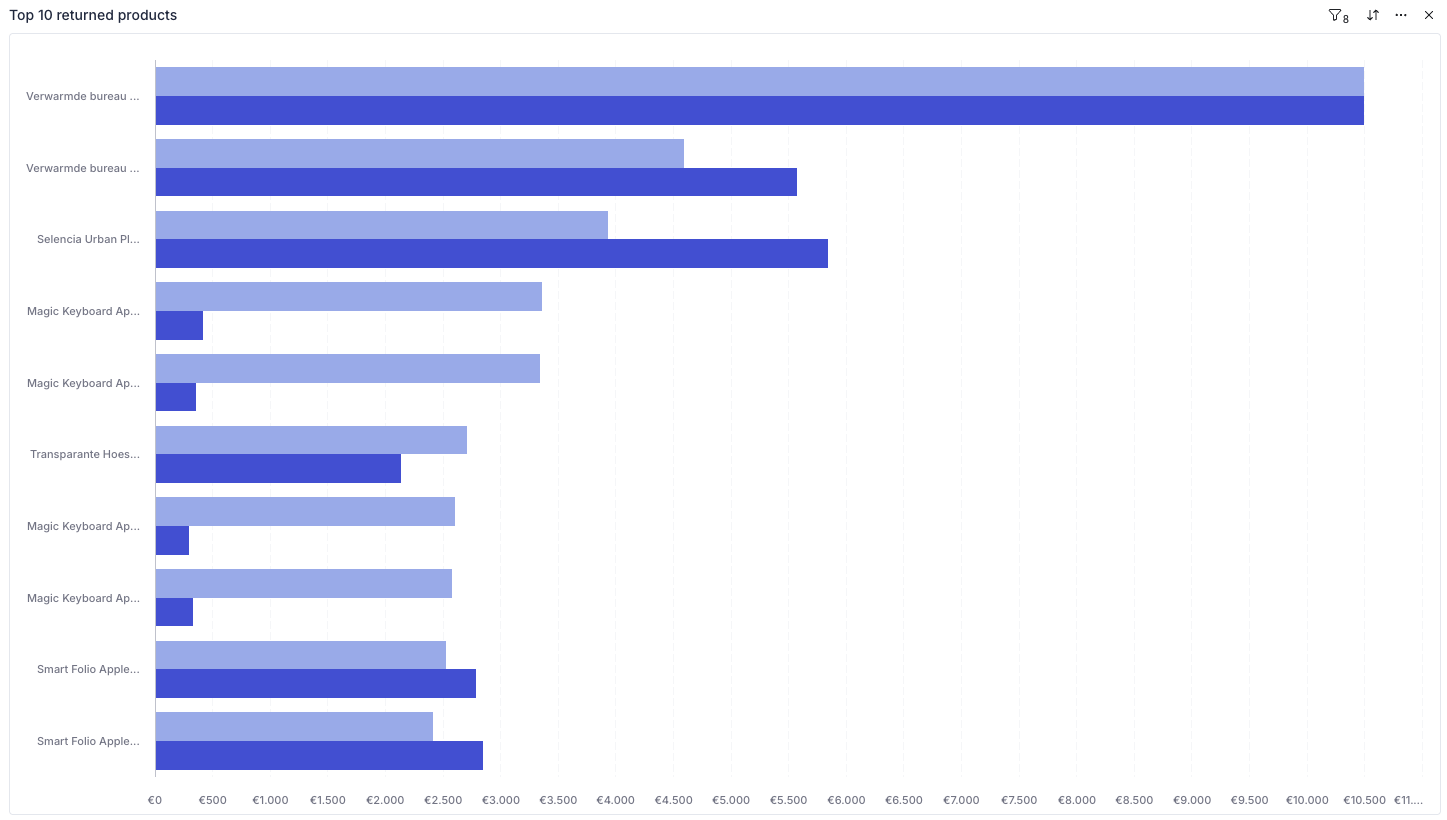
This bar chart identifies your most returned items by value.
- The light blue bar represents the value of returns from the previous period.
- The dark blue bar represents the value for the current period.
- This is a vital tool for spotting "problem" products that may have sizing issues, poor descriptions, or quality defects.
Products Data Table
The bottom of the report contains a granular, line-by-line list of every return. This table includes:
- Created at: Date the return was initiated.
- Return order: The unique return ID.
- Product & SKU: Identifying details of the item.
- State: The current status (e.g., return-announced, processing, or request-pending).
- Reason: The customer's selected reason and any additional open-text feedback.
Filtering using the Controls Sidebar
On the right-hand sidebar, use the Controls panel to narrow down your data. You can filter by:
- Date range: (e.g., last 30, 60, or 90 days).
- Product/SKU: Look up data for a specific item.
- Return Reason: View data only for specific issues like "damaged" or "wrong size."
Exporting Reports
If you need to share this data with your team or perform an external audit, you can export the data in several ways:
- Global Export: Click the Export button at the top right of the page to download the entire dashboard as a PDF, PNG, or Excel file.
- Widget Export: Hover over a specific chart (like Top 10 Products) and click the "three dots" icon to export just that specific data set as a CSV (Raw or Formatted) or image file (SVG, JPEG, PNG).