Retention analytics
The Retention Analytics report is designed to help you track how effectively you are retaining revenue during the return process. By comparing traditional refunds to store credit (coupons/gift cards), you can measure customer loyalty and the financial impact of your return policy.
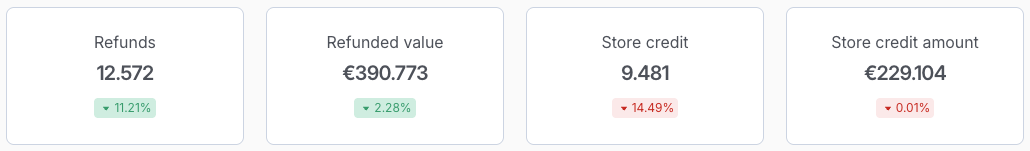
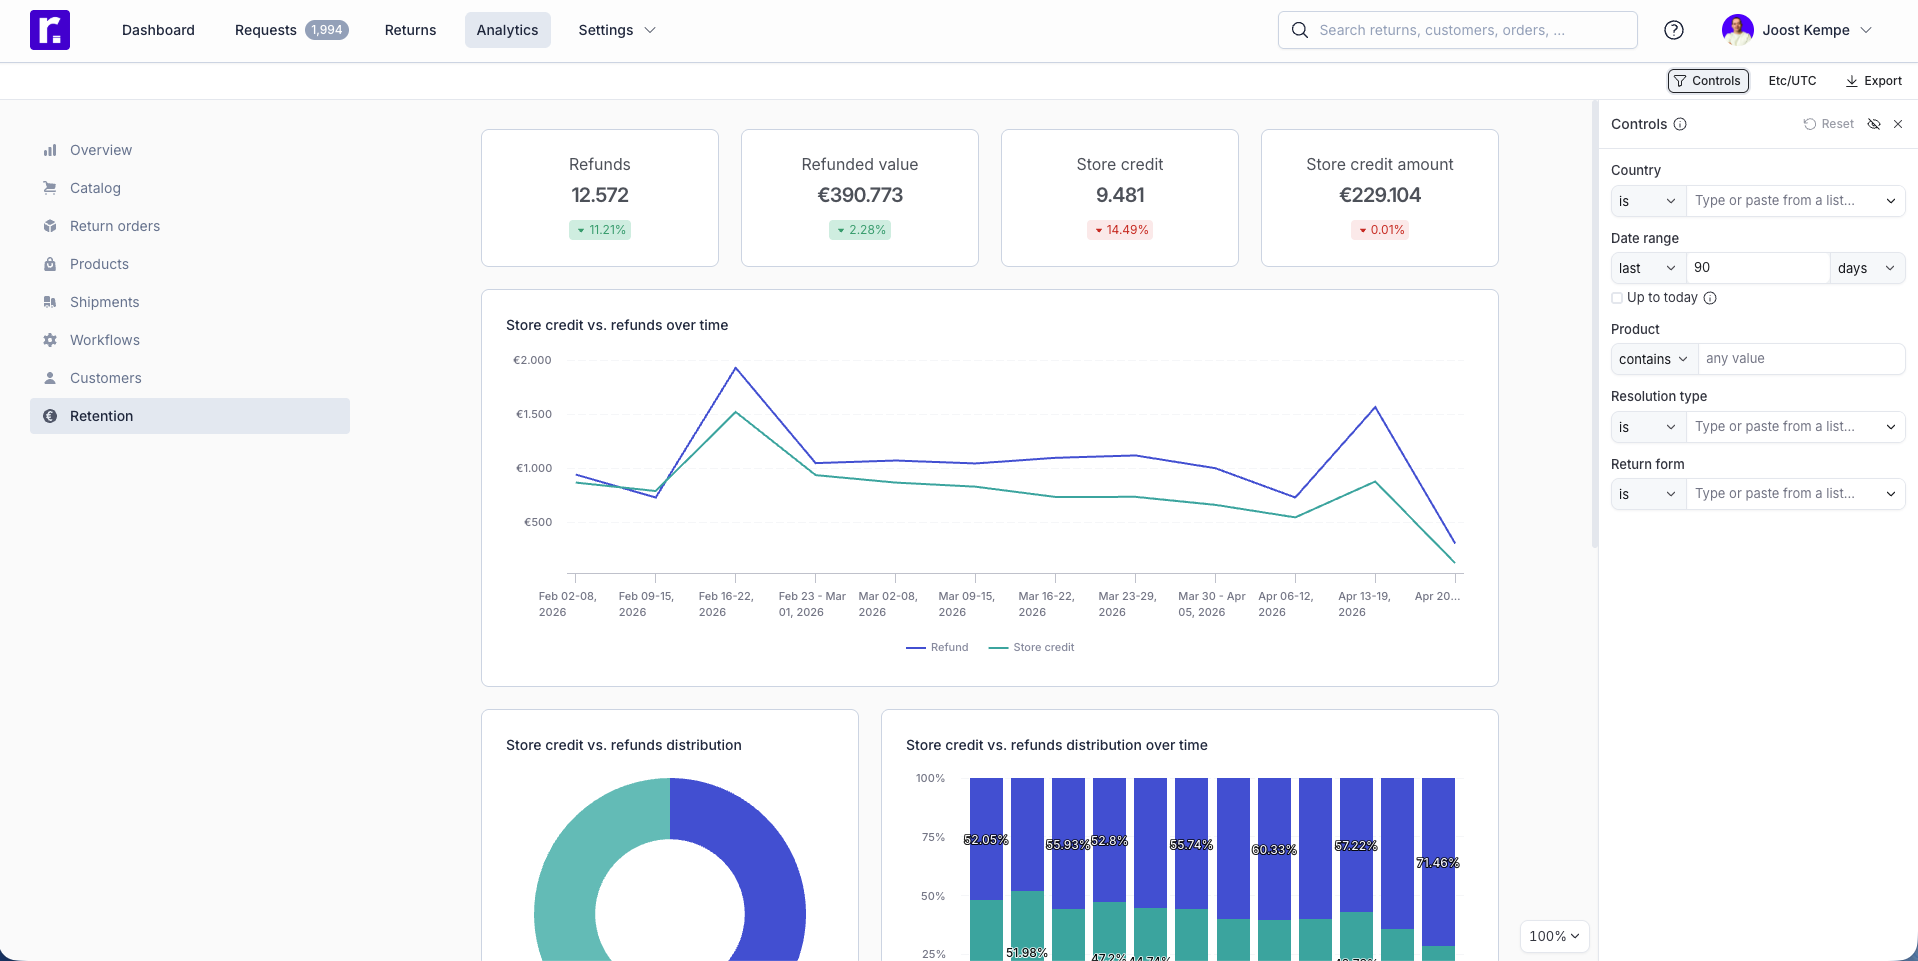
Key Performance Indicators
The top cards provide a quick snapshot of your "outbound" vs. "retained" value:
- Refunds: Total number of return orders resolved as a cash refund.
- Refunded value: The total monetary amount returned to customers’ original payment methods.
- Store credit: Total number of return orders resolved via a digital voucher or coupon.
- Store credit amount: The total monetary value retained within your ecosystem as credit.
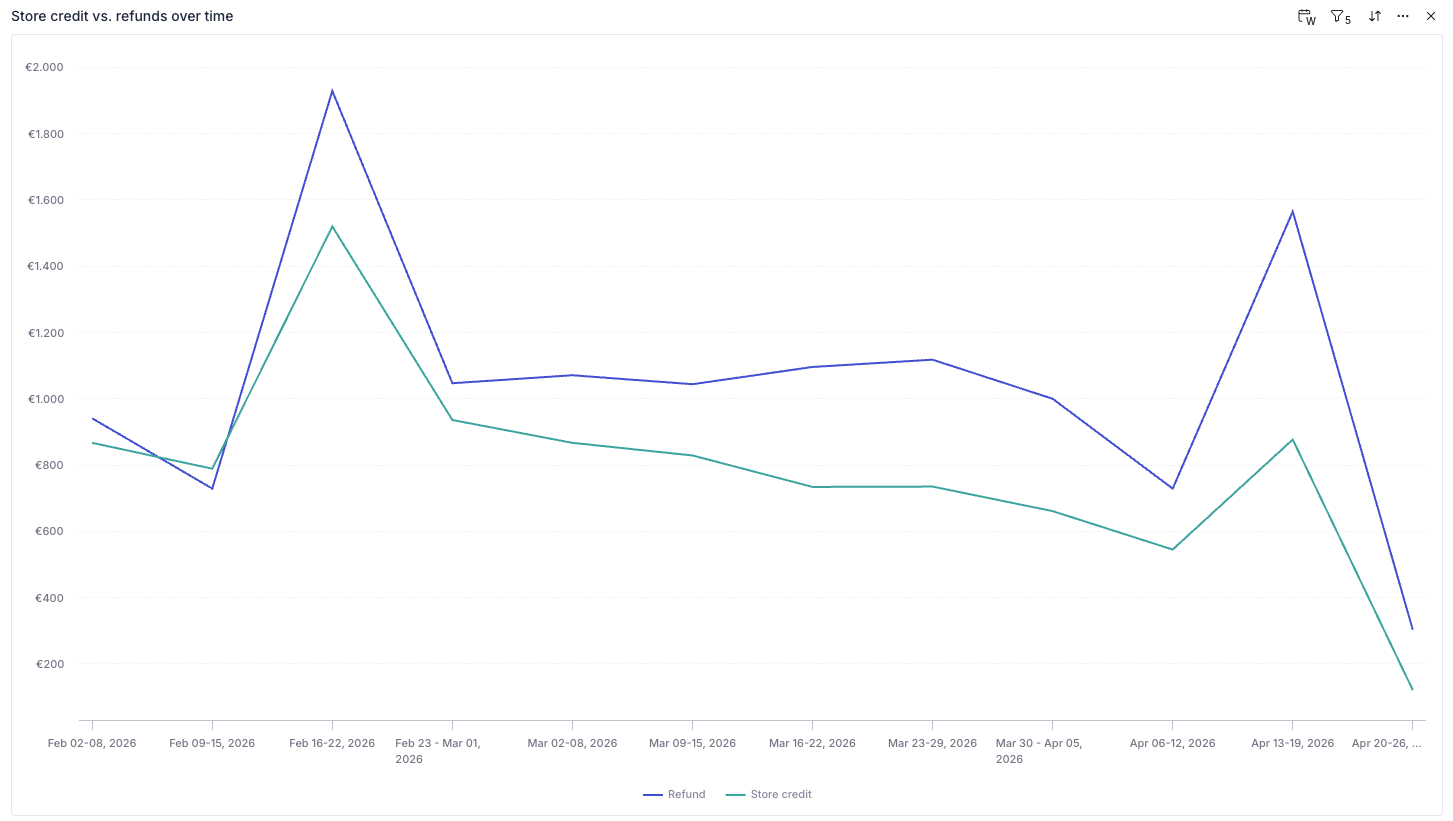
Store Credit vs. Refunds Over Time
This dual-line chart allows you to monitor the daily or weekly volume of both resolution types.
- Blue Line: Represents the value of cash refunds.
- Teal Line: Represents the value of store credit issued.
Ideally, you want to see the teal line trending closer to (or above) the blue line, indicating high customer retention.
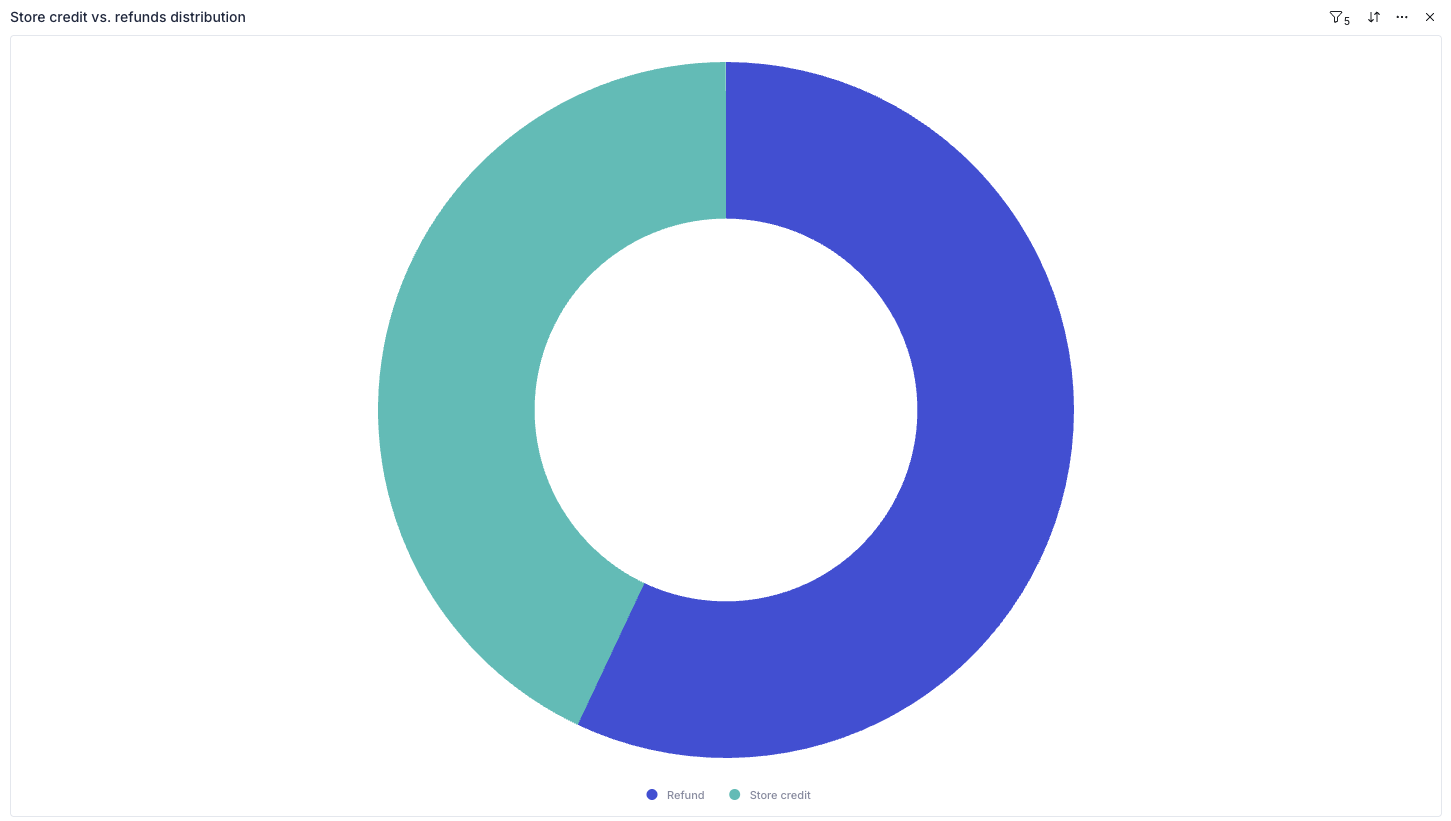
Distribution Overview
These two charts help you visualize your "Retention Rate":
-
Distribution Donut: Shows the overall split between refunds and store credit for the entire selected period. It gives you a "big picture" view of customer preference.
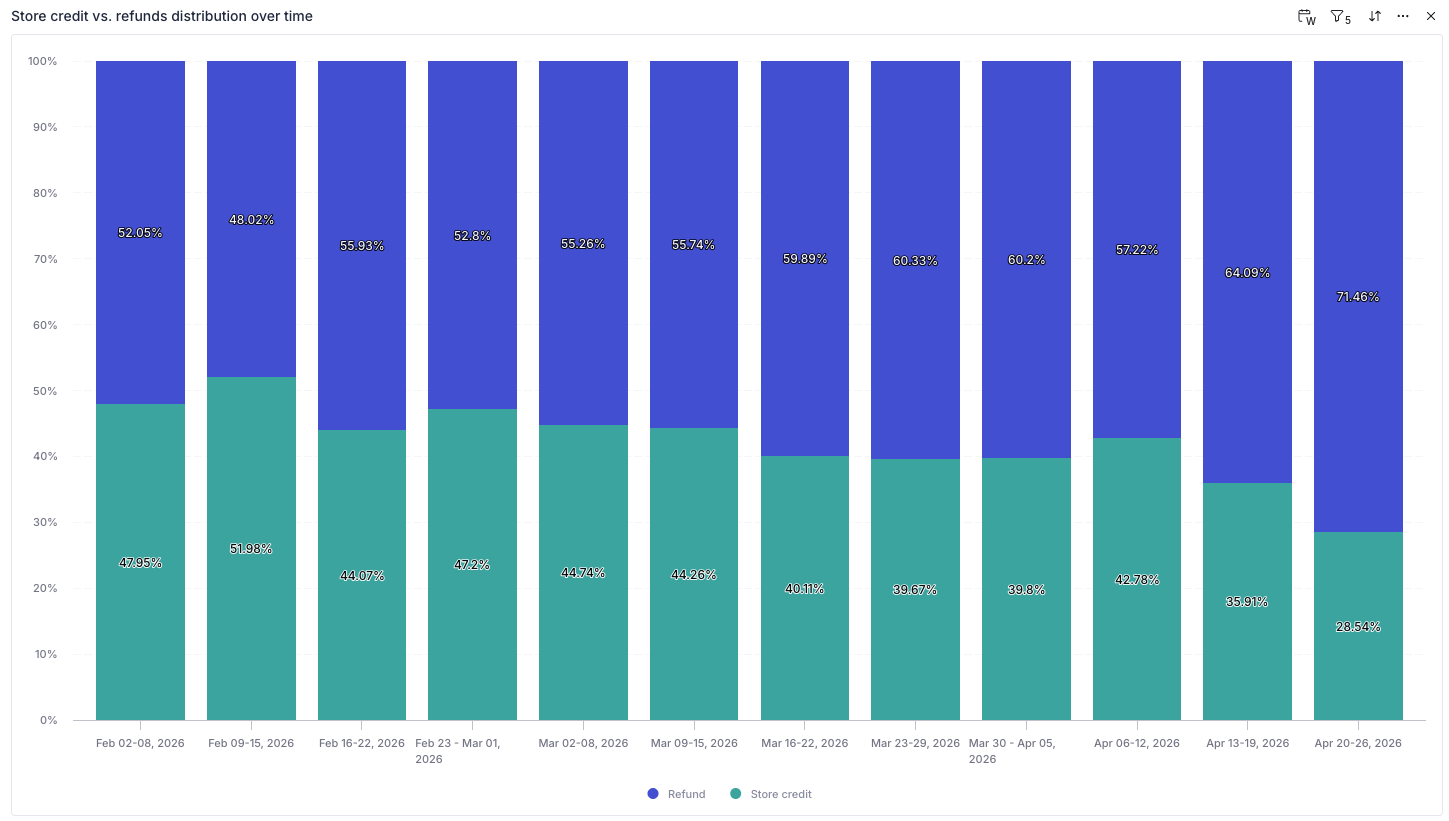
-
Distribution Over Time (Stacked Bar): This shows the percentage split for each specific week or month. This is particularly useful for seeing if changes to your return policy (like offering "Free returns for store credit") are successfully shifting customer behavior over time.


Resolved Return Orders Data
The bottom table provides the specific details for every resolved return:
- Refund type: Identifies if the resolution was a refund or store credit.
- Amount: The specific value of that transaction.
- Form Name: Which return form the customer used (useful if you have different forms for different regions or brands).
- Country: Helps identify if customers in specific regions are more or less likely to choose store credit.
- Resolved at: The date the payout or credit was finalized.
Filtering using the Controls Sidebar
You can segment your retention data to find deeper insights:
- Country Filter: See if domestic customers are more likely to take store credit than international ones.
- Resolution Type: Filter the entire report to look specifically at the performance of your coupon/voucher system.
- Product: Search by specific products to see if certain items consistently result in cash refunds rather than exchanges or credit.
Exporting Reports
If you need to share this data with your team or perform an external audit, you can export the data in several ways:
- Global Export: Click the Export button at the top right of the page to download the entire dashboard as a PDF, PNG, or Excel file.
- Widget Export: Hover over a specific chart and click the "three dots" icon to export just that specific data set as a CSV (Raw or Formatted) or image file (SVG, JPEG, PNG).