Return order analytics
The Return Order Analytics report serves as your high-level executive summary. It combines volume metrics with financial data to give you a clear picture of how many returns are coming in and, more importantly, how much value you are successfully retaining through exchanges or store credit.
Key Performance Indicators
The top row of the report highlights the overall scale of your return operations:
- Return orders: The total number of individual return requests submitted.
- Items returned: The total quantity of physical items included in those return orders.
- Returned value: The gross monetary value of all items currently being returned.
- Retained value: The total value of the sales order that was retained by your customers.

Return Orders Created Over Time
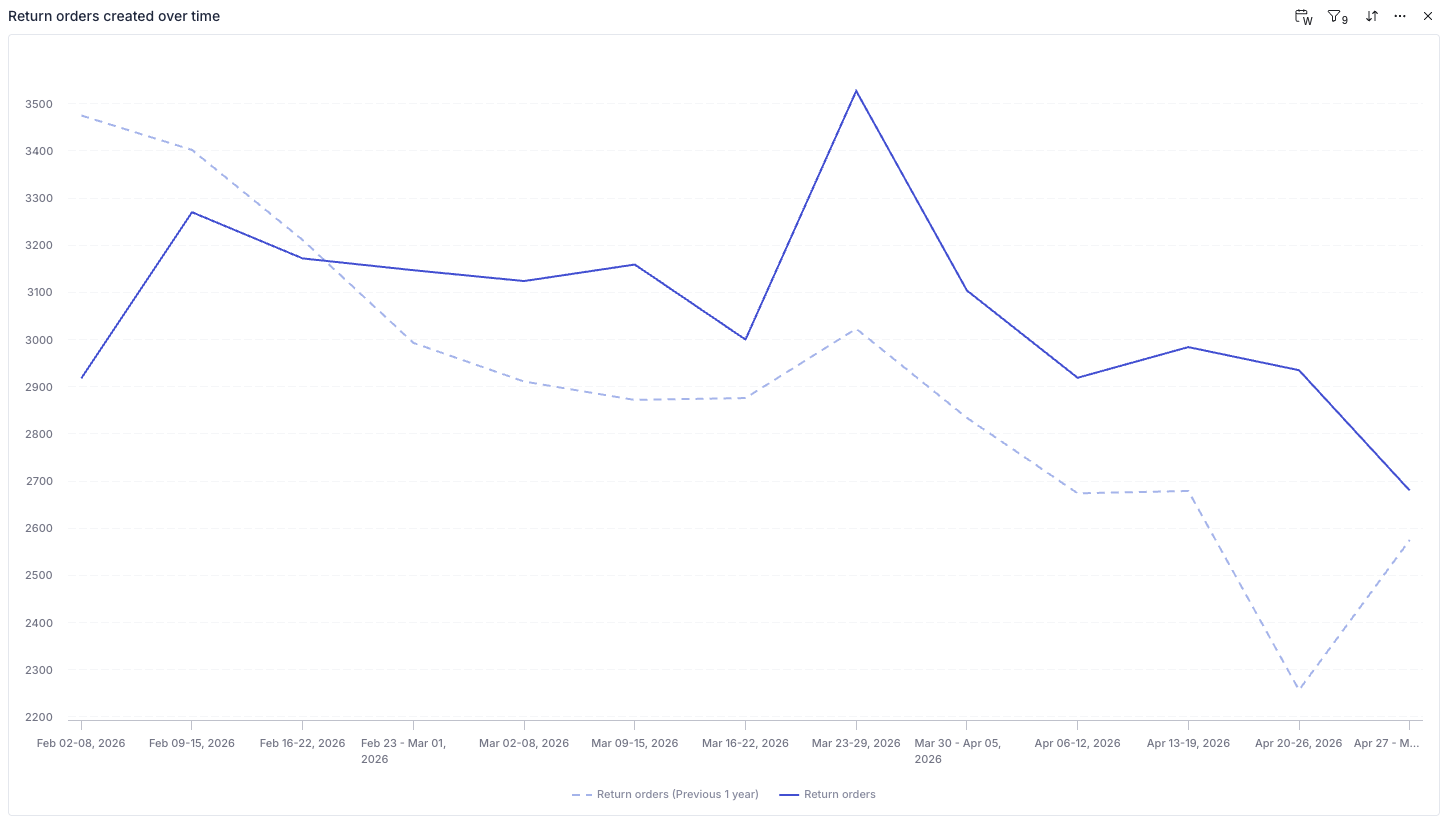
This chart allows you to visualize workload and seasonality.
- Solid Line: Displays return order volume for your currently selected date range.
- Dashed Line: Displays volume from the previous year.
- Use this chart to determine if your current return rate is following historical patterns or if a recent marketing campaign or product launch has caused an unexpected spike in returns.
Return Order Tags
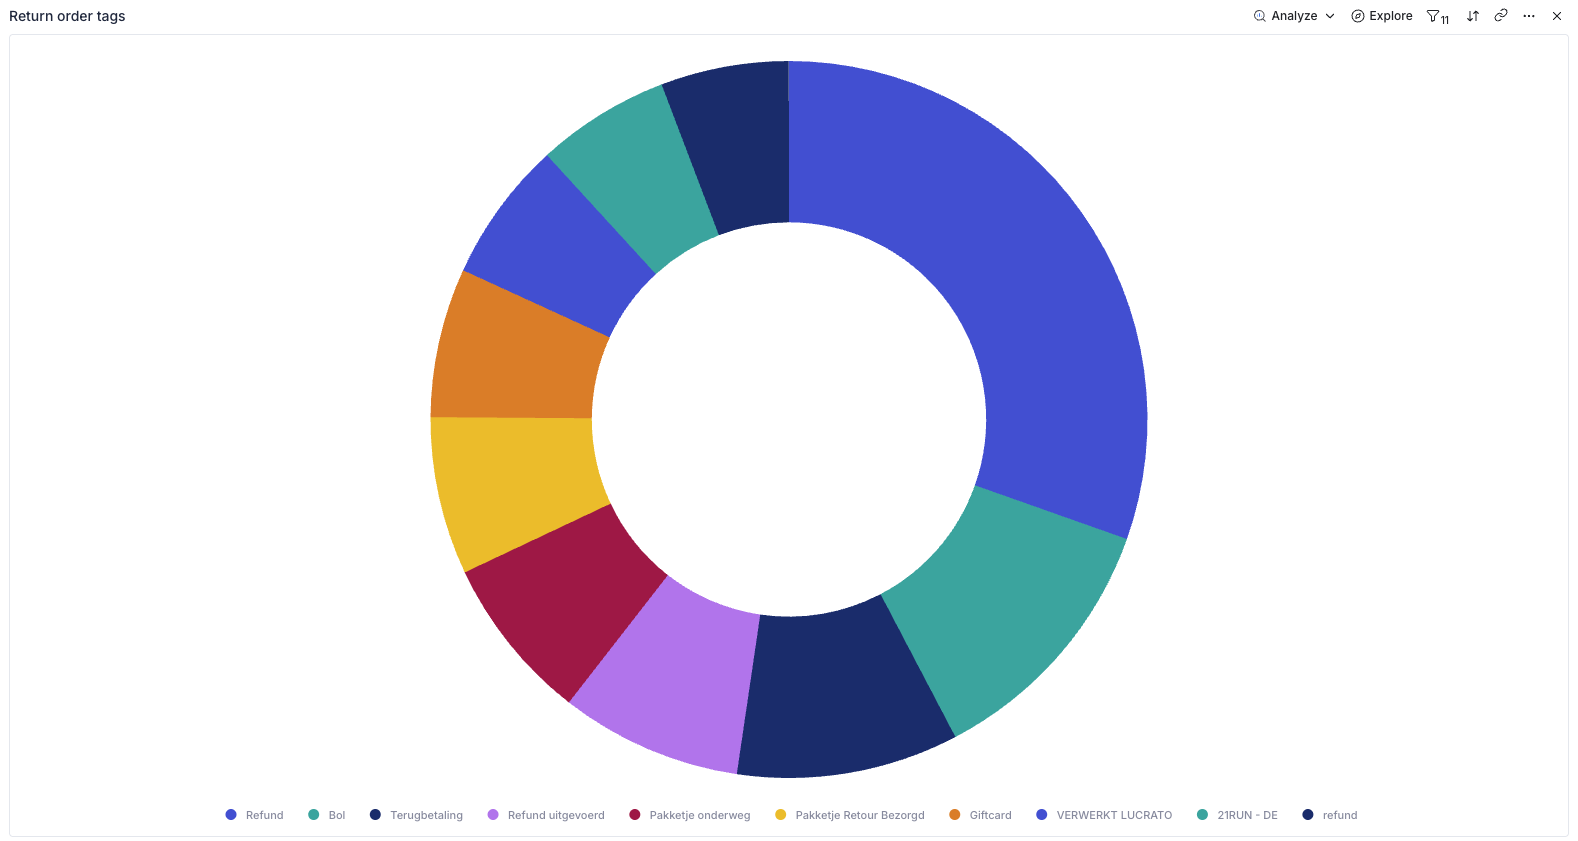
This donut chart categorizes your returns based on the Tags applied to them (either manually or via automated Workflow rules).
- Common tags might include specific marketplaces (e.g., "Bol"), status updates (e.g., "Pakketje onderweg"), or payment types.
- Hover over any segment to see how many return orders fall under that specific tag. This is an excellent way to see which sales channels or fulfillment centers are generating the most return activity.
Avg. Returned vs. Retained Value
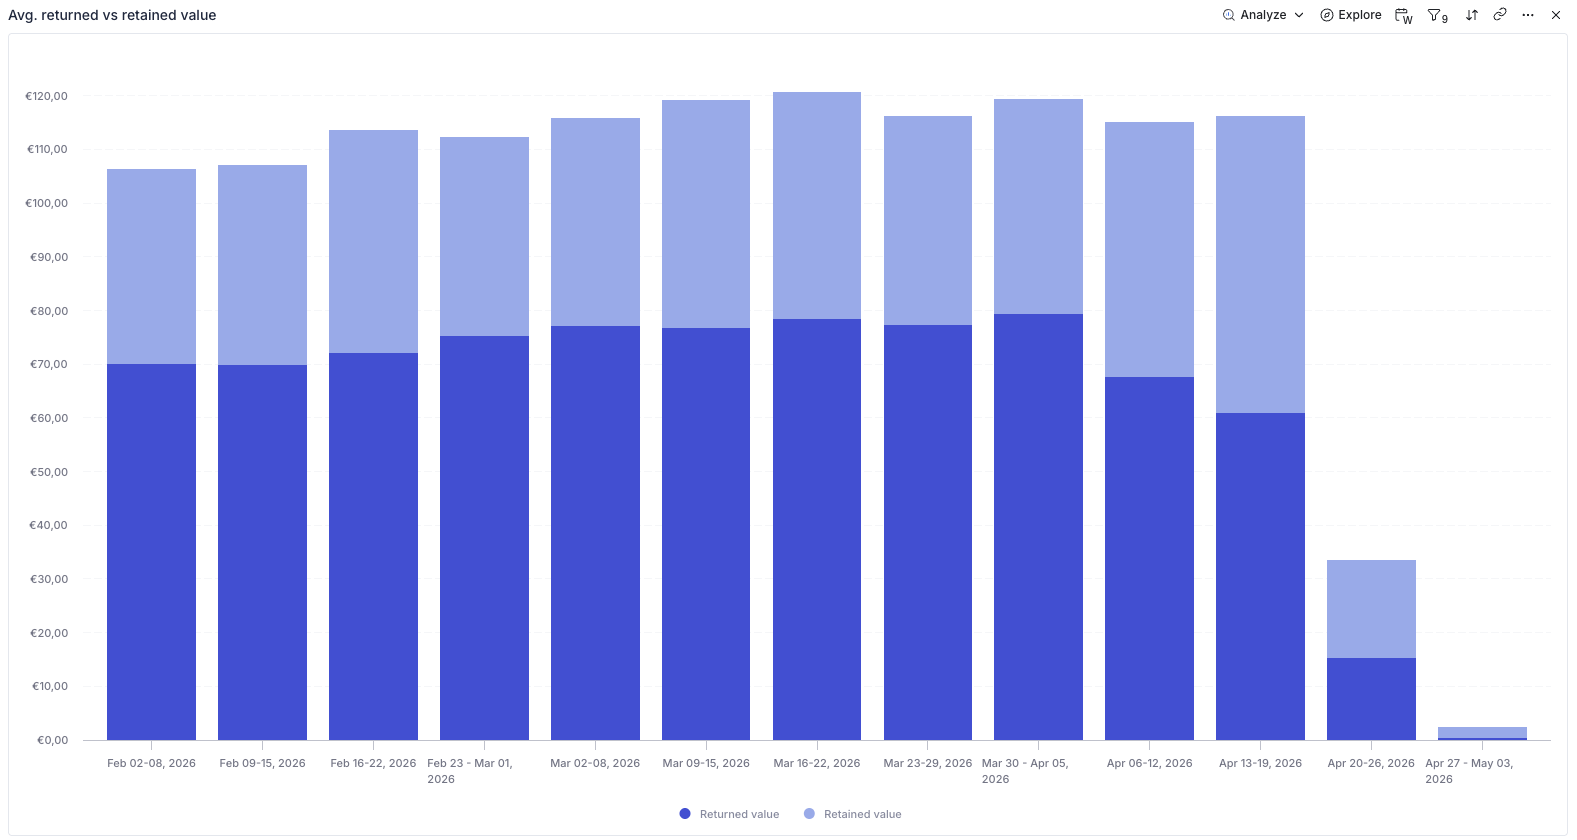
This stacked bar chart provides a week-by-week financial health check.
- Dark Blue Bar (Returned value): Represents the average value per order that left your business as a refund.
- Light Blue Bar (Retained value): Represents the average value per sales order that the customer did not return.
Return Order Data Table
The table at the bottom provides a detailed audit trail of every return request:
- Type: Shows the current phase of the return order.
- Sales order: The original purchase value.
- Returned / Retained value: A side-by-side comparison for each specific order.
- Tags: Displays all internal labels attached to the order, giving you context on why or how it was processed.
Filtering using the Controls Sidebar
Using the Controls sidebar on the right, you can slice this data to find specific insights:
- Return Status: Filter by "resolved" to see final financial outcomes, or "pending" to see what your warehouse team should expect in the coming days.
- From Country: Identify which international markets have the highest return value.
- Received Value: Use the "equal", "greater than", or "less than" toggles to find high-value returns that may require manual inspection.
Exporting Reports
If you need to share this data with your team or perform an external audit, you can export the data in several ways:
- Global Export: Click the Export button at the top right of the page to download the entire dashboard as a PDF, PNG, or Excel file.
- Widget Export: Hover over a specific chart and click the "three dots" icon to export just that specific data set as a CSV (Raw or Formatted) or image file (SVG, JPEG, PNG).