Customer analytics
The Customer Analytics report helps you understand the customer behavior behind the returns. By analyzing return frequency and geographic behavior, you can identify your most loyal customers and spot potential "serial returners" who may be impacting your profitability.
In this article:
- Key Performance Indicators
- Unique Returning Customers
- Avg. return per customer, by country
- Return Frequency vs. Returned Value
- Customer Data Table
- Filtering using the Controls Sidebar
- Exporting Reports
Key Performance Indicators
These metrics provide an overview of your customer base's return habits:
- Unique customers: The total number of unique individuals who initiated a return.
- Return orders: The total volume of return requests (a single customer may have multiple orders).
- Avg. returned value: The average monetary value a customer sends back per return.
- Avg. retained value: The average amount of value from the sales order that customers retain.

Unique Returning Customers
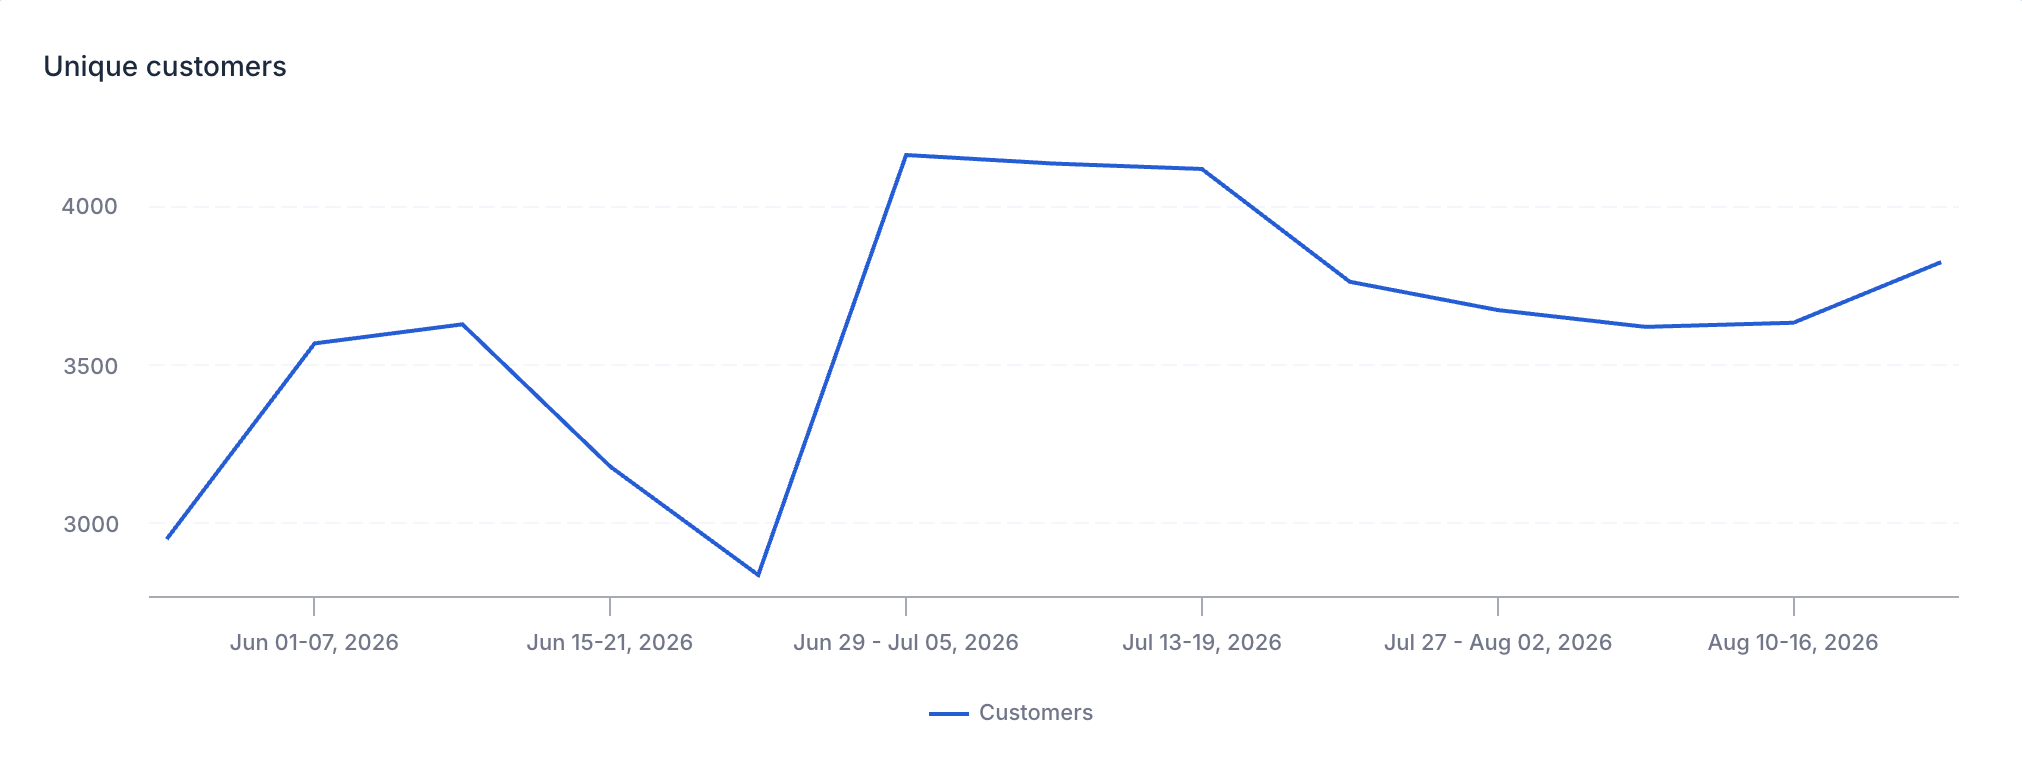
This line chart tracks how many individual customers are interacting with your return portal over time, broken down per week. Use this to see if your "returning customer" base is growing faster than your overall sales, which might indicate a need to review product descriptions or quality.
Avg. return orders per customer, by country
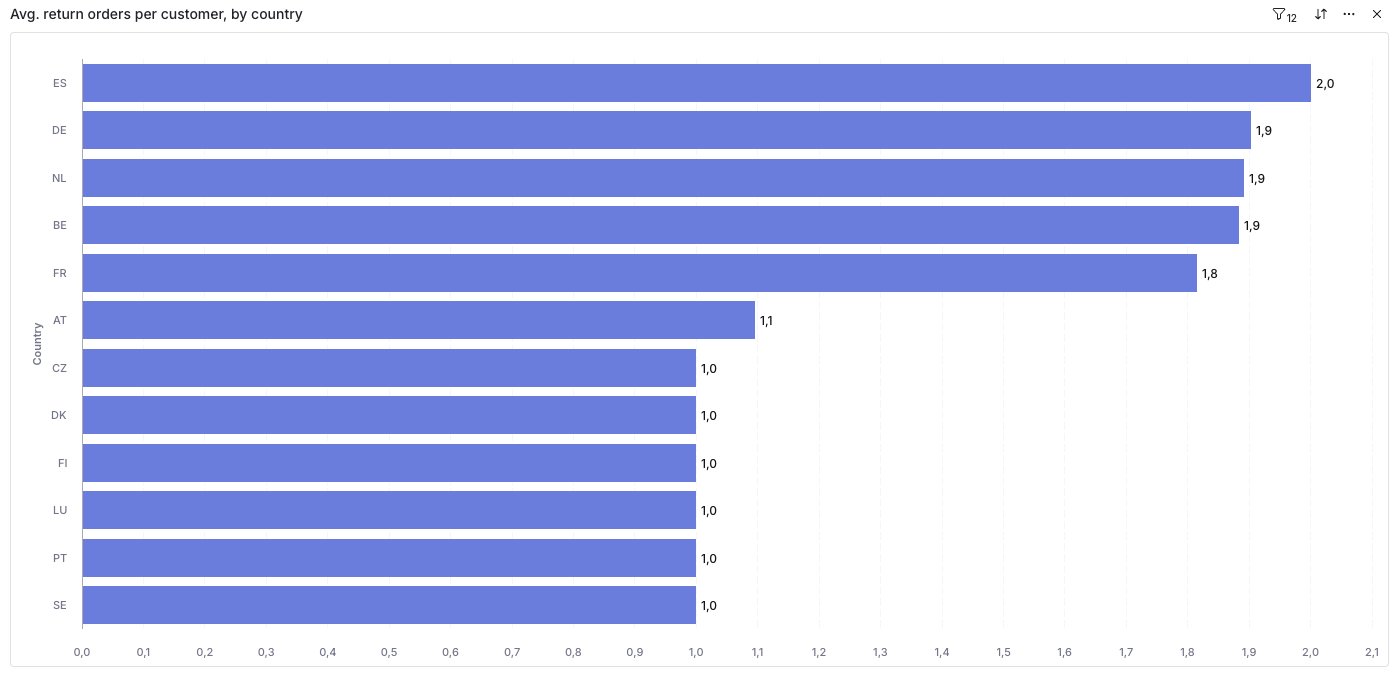
This bar chart shows, per country, the average number of return orders submitted per unique customer. Use this to spot markets where individual customers are returning more frequently than average, which may point to local sizing, delivery, or product-fit issues.
Return Frequency vs. Returned Value
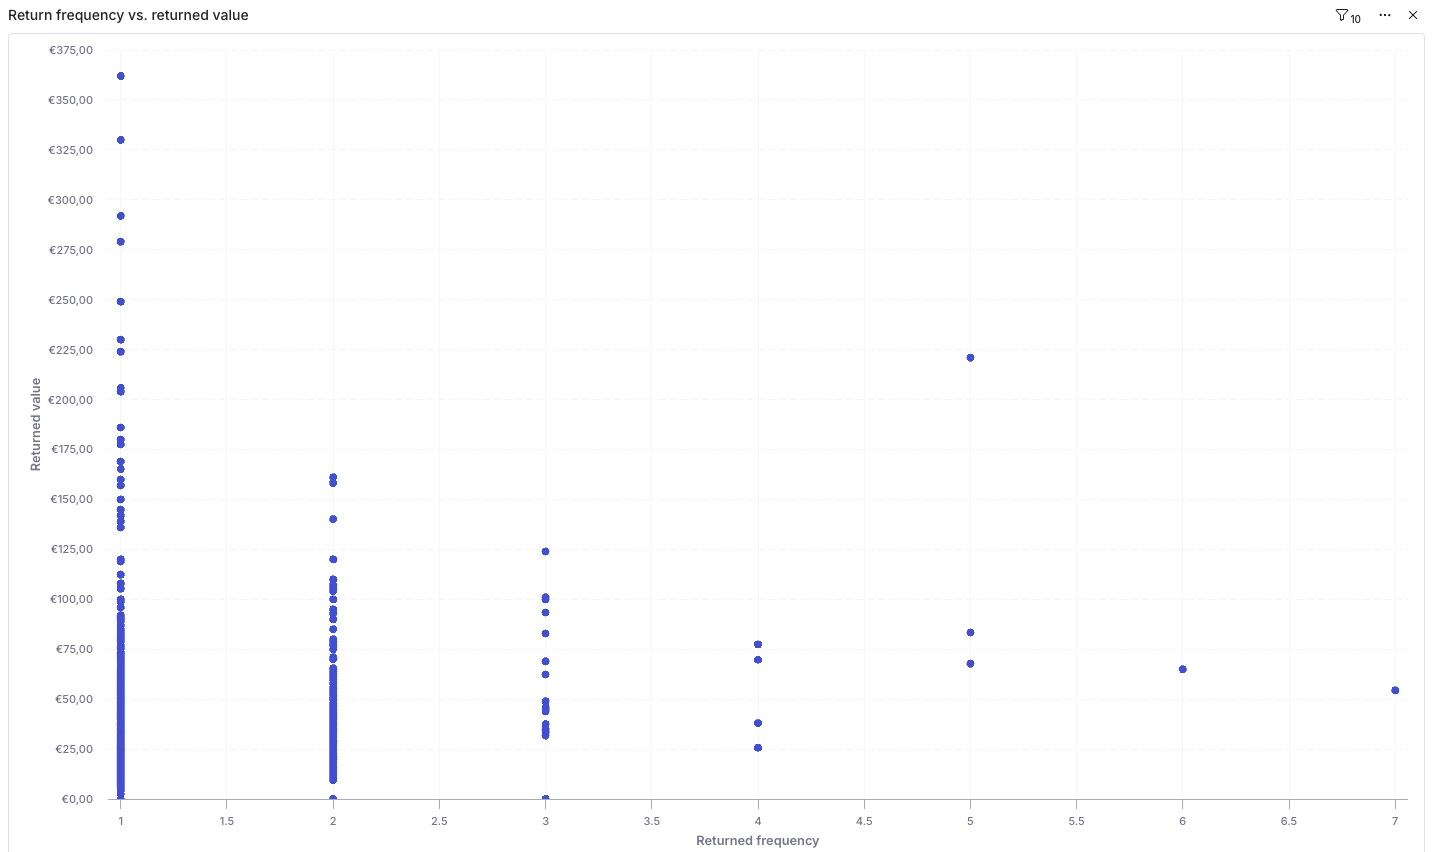
This scatter plot is your primary tool for identifying "Serial Returners."
- X-Axis (Horizontal): How many times a customer has returned items (Frequency).
- Y-Axis (Vertical): The total value of those returns.
- How to read it: Most customers will cluster on the left (1-2 returns). Dots further to the right represent individuals who return items very frequently. High-frequency, high-value dots may warrant a manual review of those customer accounts.
Customer Data Table
The bottom table gives you a direct line to individual customer details:
- Created: The date the return order was created.
- Return order: The unique return ID.
- State: The current status of the return order.
- Customer name: The name of the individual.
- Customer email: The email address of the individual customer.
- Country: The customer's country.
- Items returned: The number of items included in the return.
- Returned value: The monetary value of the returned items.
- Return form: The return form through which the request was submitted.
Filtering using the Controls Sidebar
The Controls sidebar on the right is your most powerful tool for turning broad data into actionable insights. You can use these filters to narrow down the entire report to a specific subset of customers.
- Customer Identification: Filter by Customer email or Customer name to pull up the return history for a specific individual. This is particularly helpful for customer support teams resolving specific disputes.
- Time Period: Use the Date range filter to view data from the last 7, 30, 90 days, or a custom timeframe.
- Location Filters: Slice your data by From city, From country, or From postal code. This helps you identify if high return rates are localized to specific delivery zones.
- Return form: If you have multiple return portals (e.g., one for B2B and one for B2C), you can compare customer behavior between them.
- Return Lifecycle: Use Return order state and Return status to filter for customers who have successfully completed their returns versus those whose returns are still in progress.
Exporting Reports
If you need to share this data with your team or perform an external audit, you can export the data in several ways:
- Global Export: Click the Export button at the top right of the page to download the entire dashboard as a PDF, PNG, or Excel file.
- Widget Export: Hover over a specific chart (like Top 10 Products) and click the "three dots" icon to export just that specific data set as a CSV (Raw or Formatted) or image file (SVG, JPEG, PNG).