Access the analytics overview
The Analytics Overview gives you insight into your returns and shipments over time. From here, you can analyze volumes, reasons, and trends using filters and date ranges.
How to access the Analytics overview
- Log in to your Returnless panel.
- In the main navigation, click Analytics.
- Open the Overview tab.
What you can see in the Overview
The Overview tab displays multiple graphs that help you understand your return activity:
-
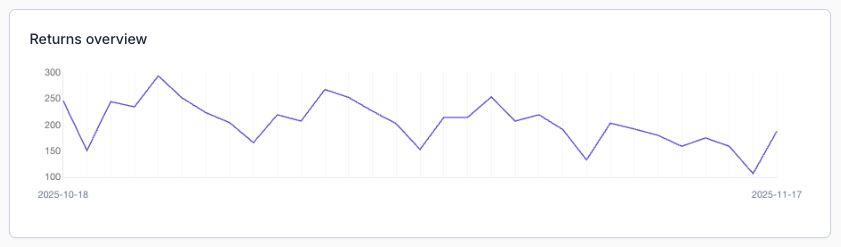
Returns over time
-
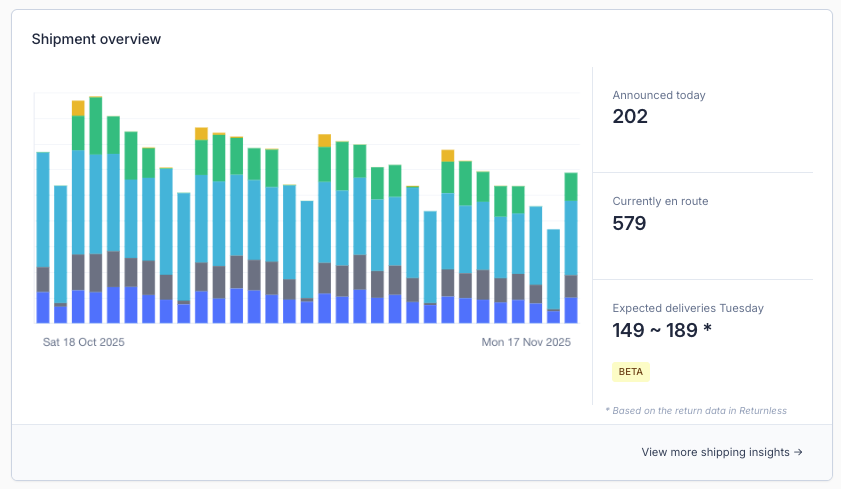
Shipments over time
-
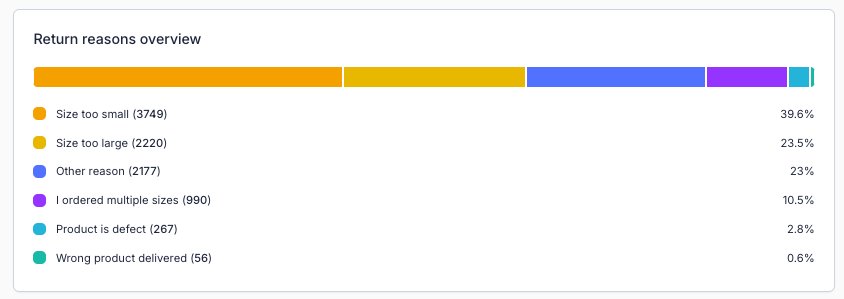
Overview of return reasons


You can adjust the displayed data by selecting a custom time period with the date picker.
Available filters
You can refine the analytics by using the filters on the left side of the overview page. These filters allow you to focus on specific subsets of returns or shipments.

Filter overview
| Filter name | Description |
|---|---|
| Form | View only returns and shipments submitted via a selected return form. |
| Language | Filter by the language in which the return or shipment was submitted. |
| Request Status | Show only requests that match a specific request status. |
| Return Status | Show only returns with a particular return status. |
| Value From/To | Display returns within a specific value range. |
| QTY From/To | Display returns within a specific quantity range. |
| State | Filter returns based on their current state. |
These filters can be combined to create detailed and targeted analyses.