Shipping analytics
The Shipping Analytics report provides deep visibility into your logistics performance, carrier efficiency, and shipping costs. Use this data to audit your shipping spend, monitor carrier delivery times, and optimize your return shipping strategy.
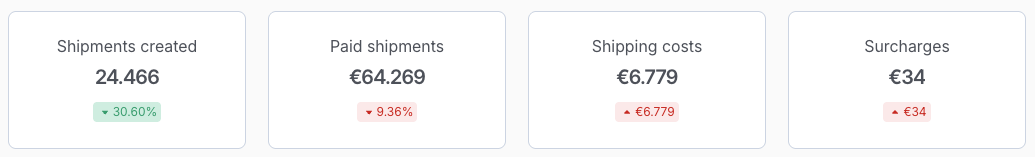
Key Performance Indicators
These metrics summarize your shipping activity for the selected period:
- Shipments created: The total number of return labels generated.
- Paid shipments: The total revenue collected from customers who paid for their return labels.
- Shipping costs: The total amount you are being charged by carriers for these shipments.
- Surcharges: Unexpected costs added by carriers (e.g., for incorrect dimensions, manual processing, or out-of-area deliveries).
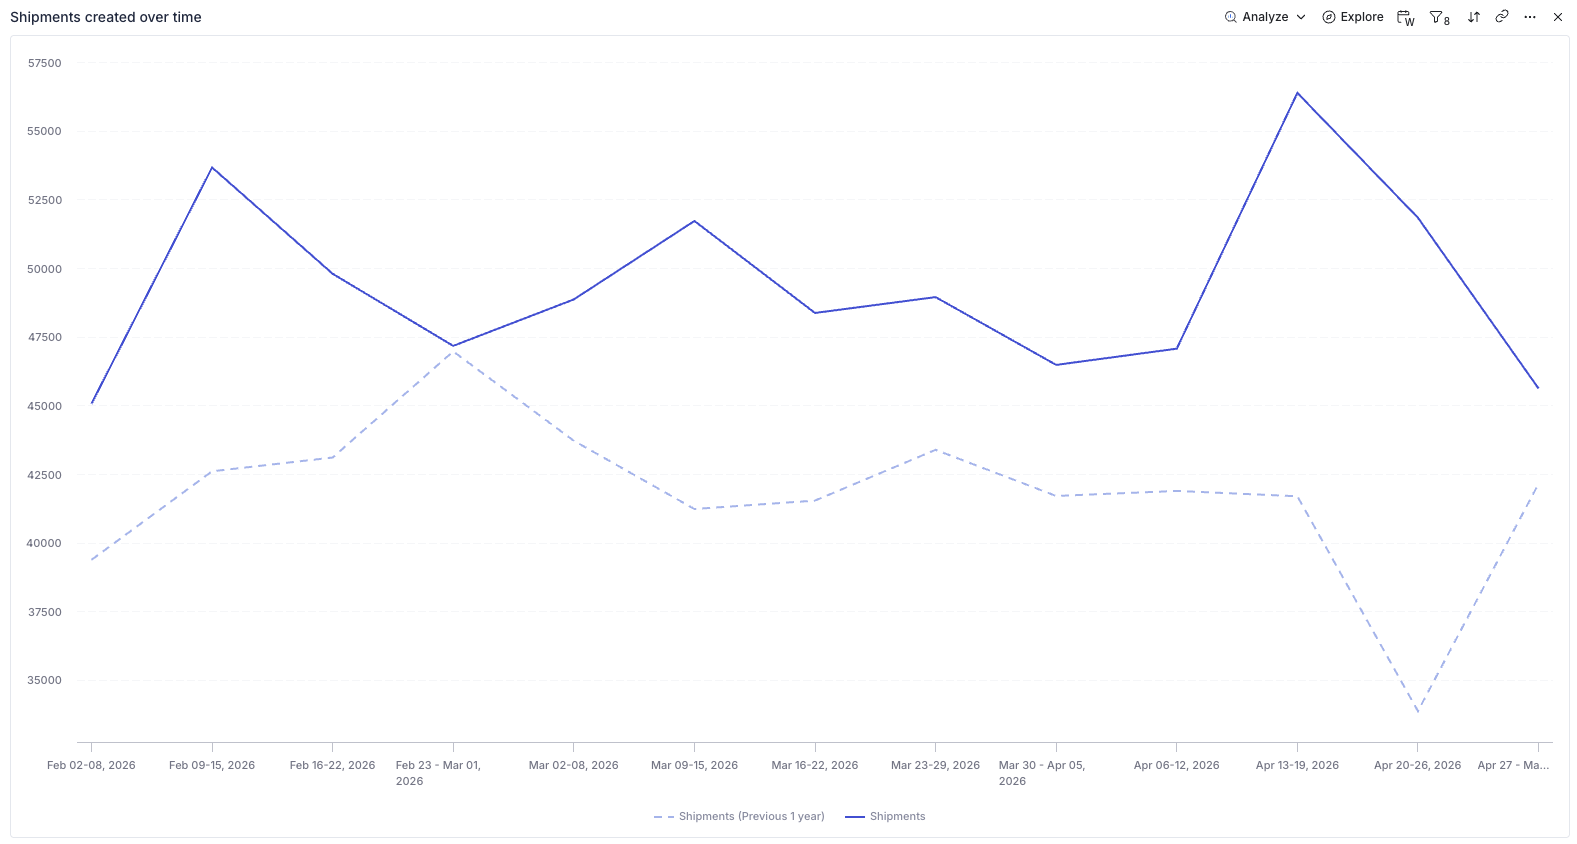
Shipments Created Over Time
This chart compares your current shipping volume against the previous year.
- Solid Line: Current period shipments.
- Dashed Line: Shipments from the same timeframe last year.
- Use this to predict seasonal peaks and ensure your warehouse is adequately staffed for incoming volumes.
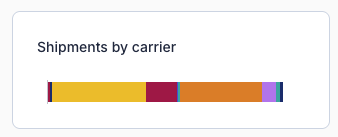
Carrier & Logistics Distribution
Understanding which carriers are handling your returns helps you manage your contracts more effectively.
-
Shipments by carrier: A visual breakdown of volume per carrier (e.g., DHL, PostNL, DPD). Hover over segments to see exact shipment counts.
-
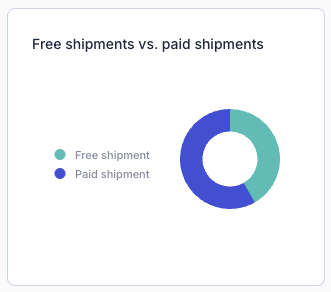
Free vs. Paid shipments: This donut chart shows the ratio of returns you paid for versus those paid for by the customer. This is a key indicator for evaluating the financial health of your return policy.


Carrier Performance & Costs
This section helps you grade your logistics partners:
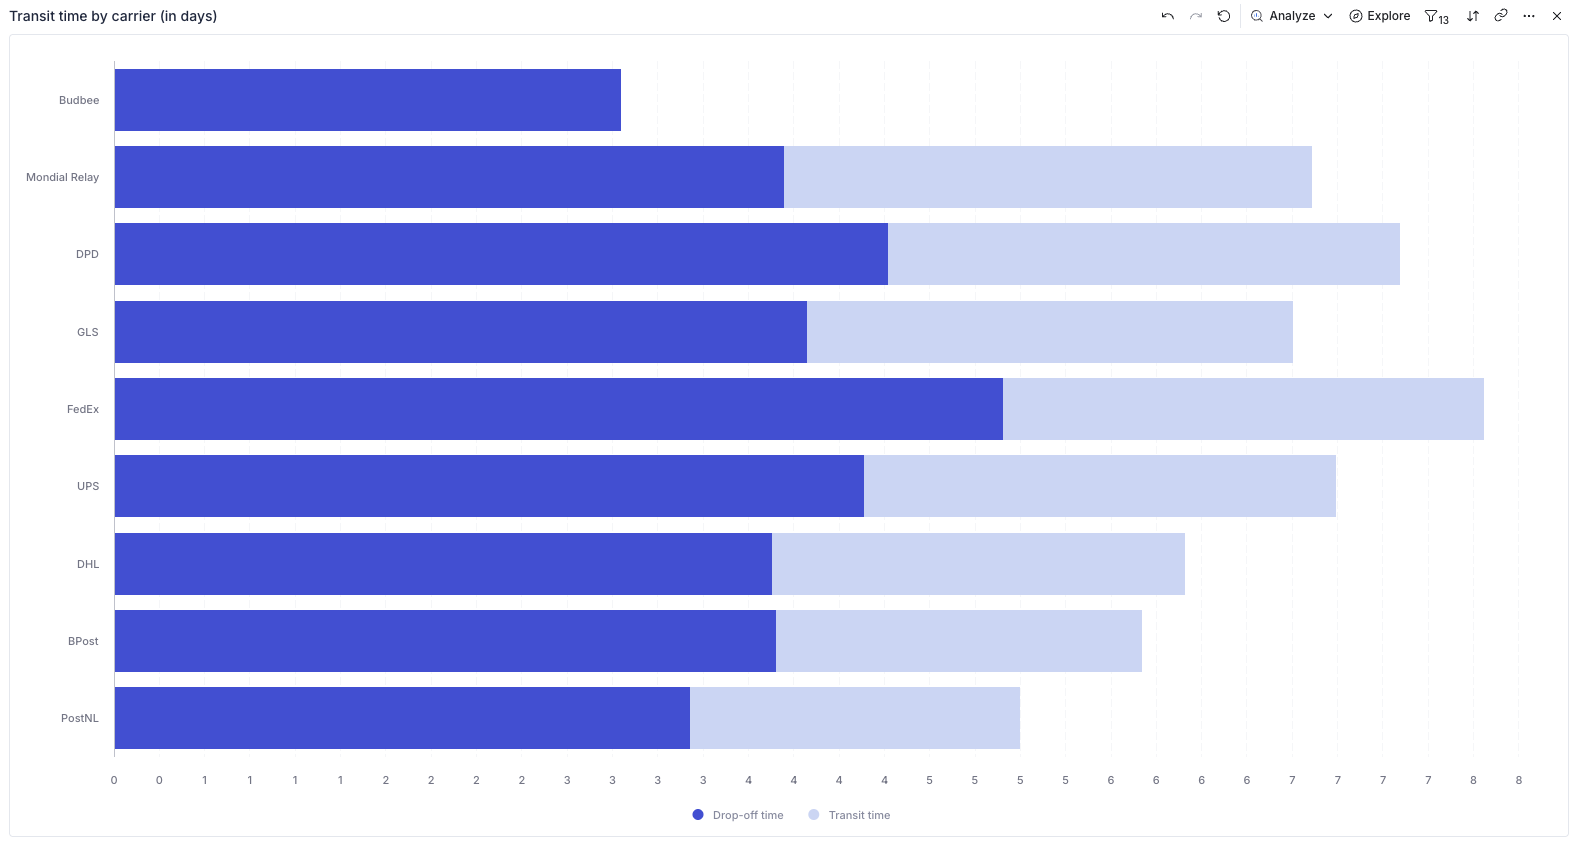
- Transit time by carrier (in days):
- Dark Blue (Drop-off time): The time between the label being created and the customer dropping it off.
- Light Blue (Transit time): The time the package spent with the carrier before being delivered.
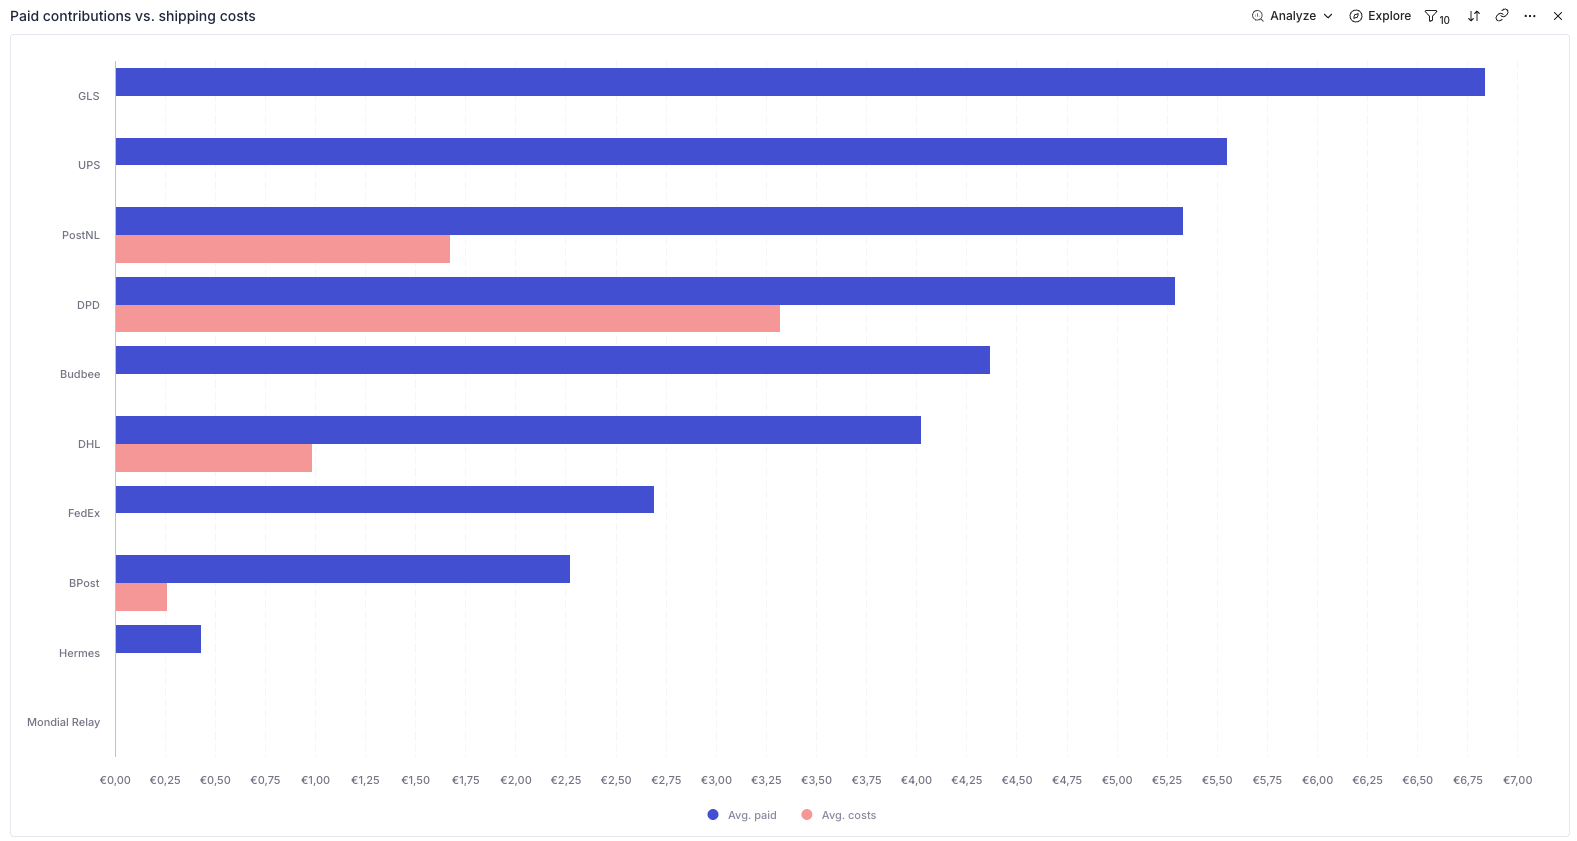
- Paid contributions vs. shipping costs: This bar chart compares what you charged the customer (Avg. paid) against what the carrier charged you (Avg. costs). Use this to ensure your return fees are covering your actual expenses.
Shipments Data
The table at the bottom provides a detailed log of every shipment, including:
- Route: The origin and destination country (e.g., DE → NL).
- Status: Real-time tracking status (e.g., delivered, in-transit).
- Sent At / Delivered At: Precise timestamps to help you verify carrier SLA compliance.
- Shipping cost vs. Paid contribution: A line-by-line financial breakdown for every single return.
Filtering using the Controls Sidebar
Use the Controls sidebar on the right to drill down:
- Surcharge Audit: Filter by "Carrier" and look at the "Surcharges" KPI to see which carrier is penalizing you the most.
- International vs. Domestic: Use the "From country" and "Returned to country" filters to compare the transit times and costs of cross-border returns.
Exporting Reports
If you need to share this data with your team or perform an external audit, you can export the data in several ways:
- Global Export: Click the Export button at the top right of the page to download the entire dashboard as a PDF, PNG, or Excel file.
- Widget Export: Hover over a specific chart and click the "three dots" icon to export just that specific data set as a CSV (Raw or Formatted) or image file (SVG, JPEG, PNG).