Workflow analytics
The Workflow Analytics report provides a deep dive into the efficiency of your return operations. It measures the balance between Automated Workflows (tasks performed by the system via return rules and automations) and User Actions (tasks performed manually by your team).
In this article:
- Key Performance Indicators
- Automated Workflows vs. User Actions
- Actions Analysis
- Workflows Data Table
- Filtering using the Controls Sidebar
- Exporting Reports
Key Performance Indicators
The top metrics track the scale and effectiveness of your automation strategy:
- Automations executed: The total number of individual actions (like tagging an order or pushing data to an ERP) completed by the system.
- User actions: The total number of manual actions performed by your staff members.
- Automation Rate: Perhaps the most important metric, this represents the percentage of all actions that were handled automatically.

Automated Workflows vs. User Actions
This section visualizes how automation scales with your return volume:
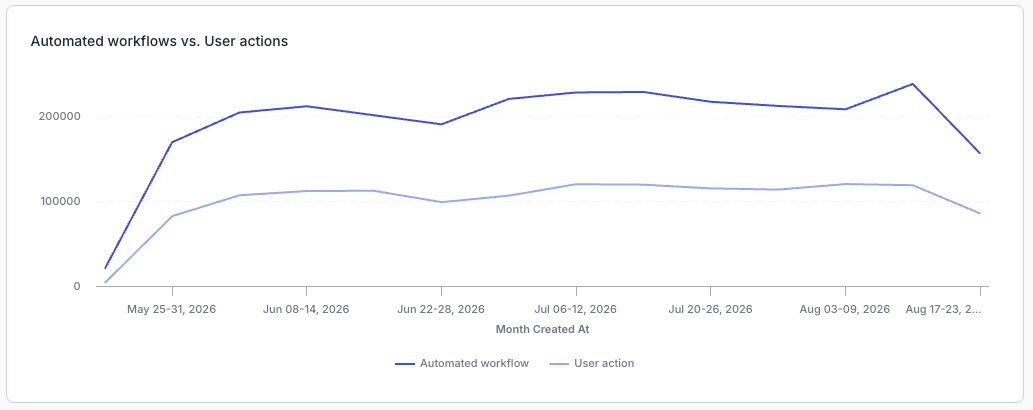
- Trend Line: Monitors the volume of automated tasks (dark blue) versus manual tasks (light blue) over time. This helps identify if your team is getting bogged down by manual work during peak periods.
-
Automation Rate: This single bar visualizes the overall split for the selected period: the percentage of actions that were handled automatically versus the percentage that required manual work by your team.

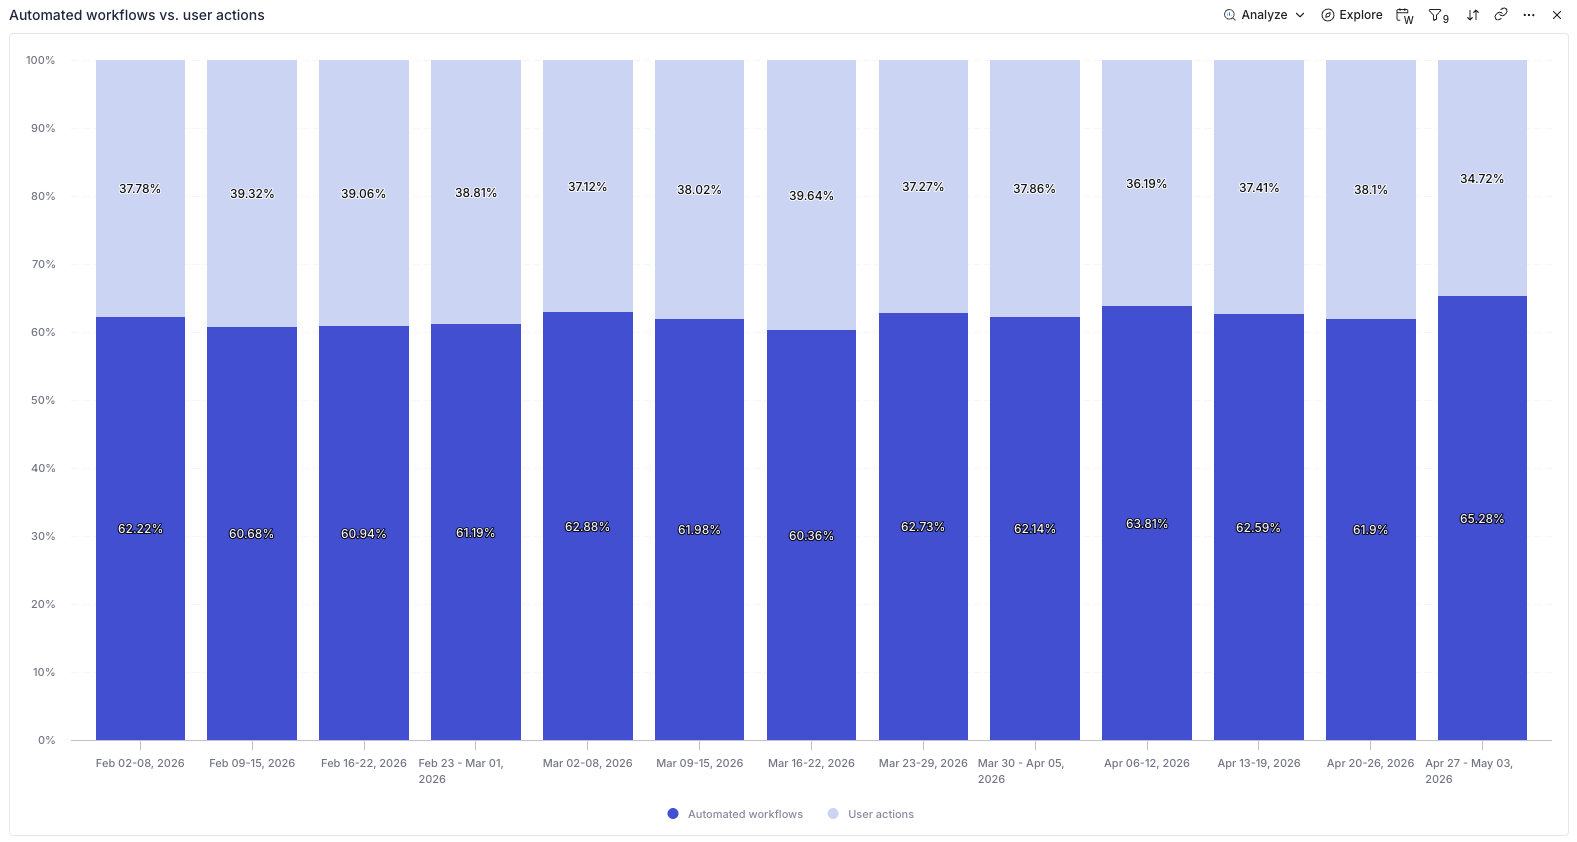
- Distribution Over Time (Stacked Bar): Shows the percentage split of automation for each specific week. It allows you to see the immediate impact of newly created return rules or automations on your overall efficiency.
Actions Analysis
This section visualizes how automation scales with your return volume:
-
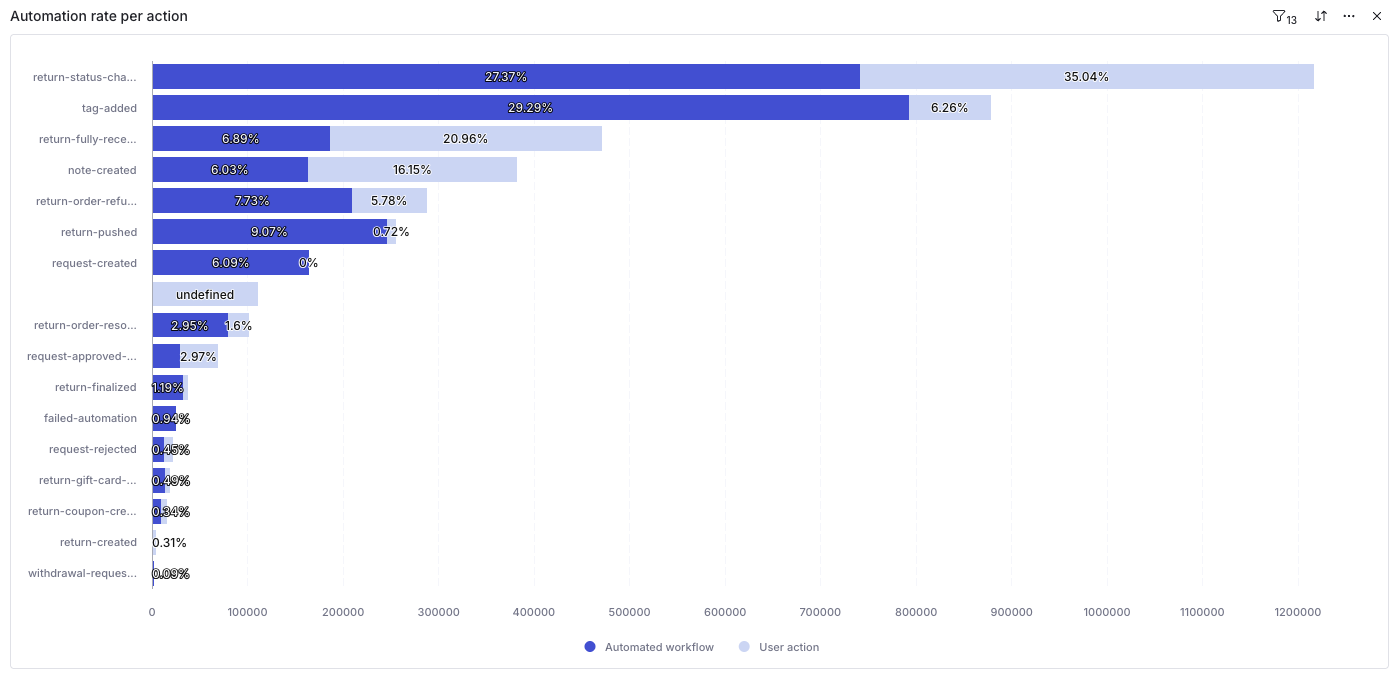
Automation rate per Action: This bar chart breaks down specific tasks to show which are most automated, comparing the automated share against the user-action share for each event type.
-
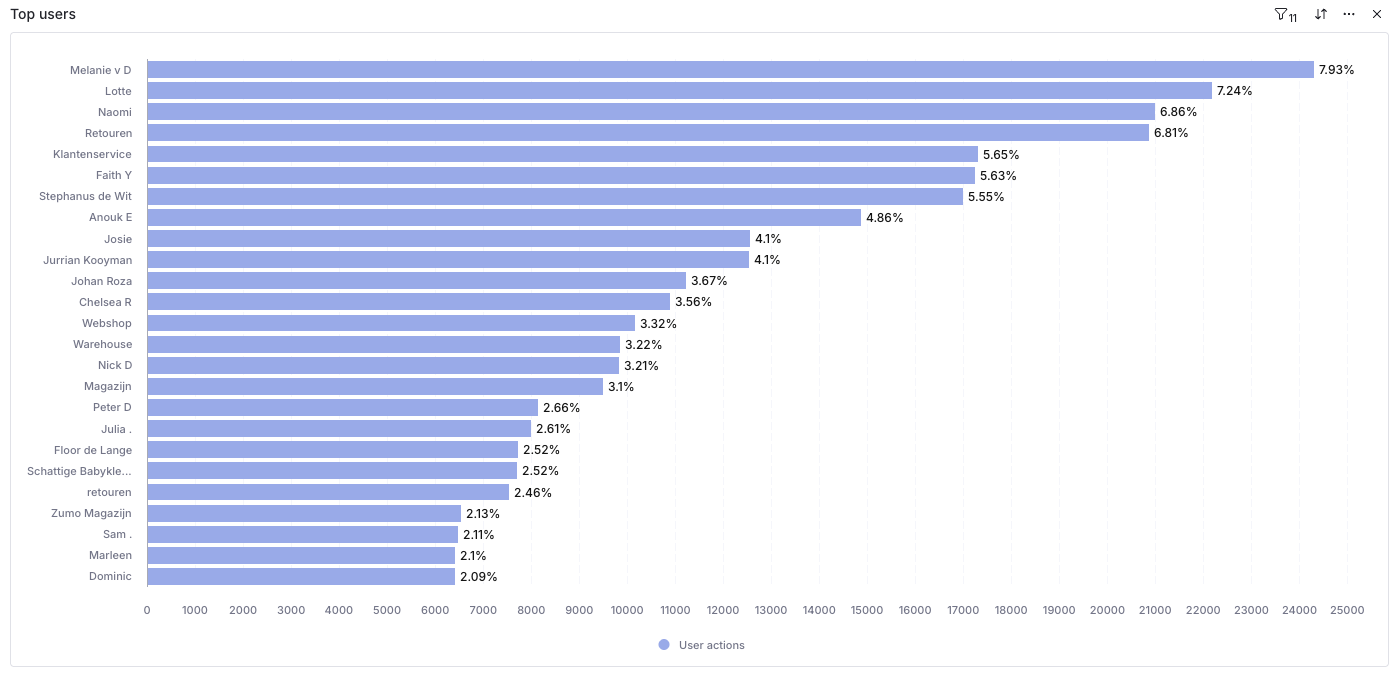
Top users: This bar chart ranks your team members (and connected accounts, like Webshop or Warehouse) by the percentage of total user actions they've performed.
Workflows Data Table
The bottom table provides a real-time audit log of every action taken within your return orders:
- Event time: The exact timestamp of the action.
- Return order: The return order the action belongs to.
- State: The current status of the return order at the time of the event.
- Return form: The return form the request was submitted through.
- Event: The specific task performed (e.g., status change or tag added).
- Actor type: Identifies if the task was completed by an Automation, Return rule, or a specific User.
- User: Displays the name of the staff member who performed the action or the name of the automation rule that was triggered.
Filtering using the Controls Sidebar
Use the Controls sidebar on the right to isolate specific parts of your workflow. Available filters include Actions, Actor name, Actor type, Date range, Request status, Return form, Return order state, and Return status. A few examples:
- Actor type: Filter on users, return rules or automations.
- Actor name: Filter for a specific User, Return Rule or Automation by name to measure its individual contribution.
- Return order state: View how automation levels differ across the various stages of a return.
Exporting Reports
If you need to share this data with your team or perform an external audit, you can export the data in several ways:
- Global Export: Click the Export button at the top right of the page to download the entire dashboard as a PDF, PNG, or Excel file.
- Widget Export: Hover over a specific chart and click the "three dots" icon to export just that specific data set as a CSV (Raw or Formatted) or image file (SVG, JPEG, PNG).